Quick Market Summary: Well, when someone tells you the market is dropping, that's false! We are still seeing year over year increases in the median prices for each county. They may be referring to sequential changes which due to seasonality are bit comparable. The supply of homes available for sale or inventory has jumped in each county with the number of accepted offers (sales) down a bit in Santa Clara County but up in San Mateo County. Demand continues below supply but the difference is more pronounced. Buyers take note as this may not last too long. Sellers, you will need to be more aggressive in pricing and look to your competition. The year over year median in Santa Clara County was up 3.6% to $1,295,000 in October and in San Mateo County the median price was $1,594,000 as compared to $1,525,000 last year at this time or a gain of 4.5%. Condo and townhouse median in Santa Clara County reached $900,000 in October compared to $767,000 last year or a jump of 17.3%. My theory is that condos and townhouses have a lower price of entry into a home than a single family home and we may be seeing an impact of higher mortgage rates which are in the 4 3/4-5% range. Even in this tempered environment 54.0% of homes in Santa Clara County that closed escrow in October sold for more than list price inferring multiple offers and the seventh highest rate for this time of year (last year was a record 75.4%). It was 68% in San Mateo County versus 84% last year.
Nuts and Bolts: Inventory or the amount of homes available for purchase in Santa Clara County was 1,393, up from 618 or 125% from last year. Sales (accepted offers) were an anemic 918 down 7.2% from the same month last year when is was 989.
For San Mateo County, inventory of single family residences stood at 545 in October versus 318 last year or an increase of 71%. Sales (accepted offers) were 382 compared to 312 for the same month last year or an increase of 22.4%.
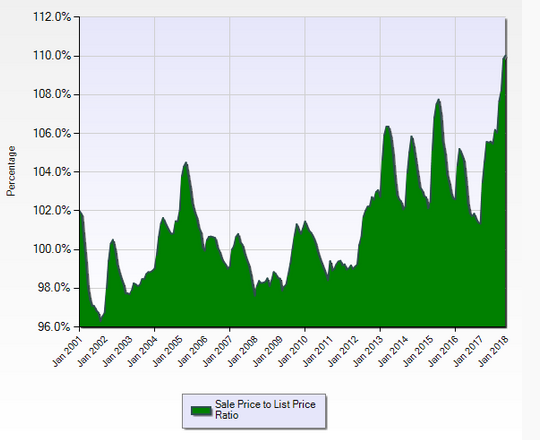
Sale price to list price ratio, an important key market condition indicator, shows that for Santa Clara County transactions completed during October, stood at 101.9% compared to last year's ratio of 107.9%.
The hottest market in Santa Clara County belongs to the Palo Alto/Los Altos market area (median price of about $3.27 million) at 105.2% which means that the average closed sale has a sale price 5.2% higher than the list price! It also registered a median days on market of just 10 which means half the inventory sells in just a bit over a week and 61% of closings sold above list price! The coolest is the Los Gatos/Saratoga market area (median price of about $2.50 million) with 98.8%.
Days of unsold inventory moved up a bit and stand at 53 for Santa Clara County and 41 for San Mateo County. These are substantially higher than last year's figures of 22 and 31, respectively.
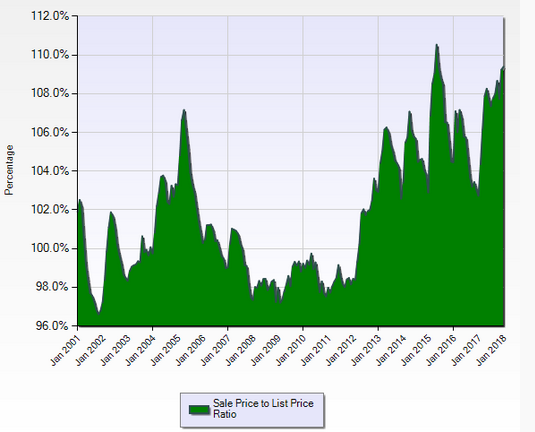
San Mateo County’s overall sale price to list price ratio stands at 106.0% with the highest ratio and hottest market area is in the North (Brisbane, Colma, Daly City, Pacifica, San Bruno, South San Francisco) market area (median price of about $1.05 million) at 109.6% with a median days on market of 16. As I pointed out before, one important advantage of this area is its proximity to San Francisco and a heck of a lot less expensive to purchase or to rent! The coolest is the Coast (Half Moon Bay, El Granada, Moss Beach, Montara) market area (median price of about $1.35 million) at 99.4% with median days on the market of 20.
As always, markets are always changing and the supply and demand in a particular area or even neighborhood can vary. If you would like specific market condition information for your area or neighborhood or a current home valuation, please feel free to call me, your RE/MAX Gold Agent! You are welcome to leave your comments or questions or contact me directly at my website. Check out and “like” my Facebook Business Page (have 775 likes – help me to reach 1,000!) or follow me on my Twitter Page.Thank you.