Quick Market Summary: Up and away. That's the characterization of the continued hot streak as November prices jumped and are 25.1% higher than the same month a year ago. Yes, you read that right! When record low inventory is mixed with a goodly amount of buyer demand, you get higher prices. Median prices continue to set records — in Santa Clara County it was $1,289,000 and $1,513,000 in San Mateo County. The Santa Clara County median price for condos/townhouses is $790,000. Demand continues to outstrip supply in Santa Clara County as 77.9% of homes that closed escrow sold for more than list price inferring multiple offers and was 75% in San Mateo County. The historical averages we've seen in most of the past 20 years of a settling down of the market come late fall, is totally out the window. The question becomes is the sharp increases we've seen at this time of the year caused by buyers getting a jump on the historically busy late winter-early spring OR will be see a continuation of the high demand next year too.
Nuts and Bolts: Inventory or the amount of homes available for purchase in Santa Clara County was a paltry 486 down from 645 last month and down from 750 the same month last year or a decrease of 35.2%! Sales (accepted offers) were 791 down from 1,003 last month and decreased 1.7% from 805 the same month last year. Closed sales were interesting — they were 738 down from 797 last month and 826 the same month last year, a decrease of 10.7%. Comparing the large reduction of inventory and the smaller drop in offers accepted, we’ve seen that turnover has accelerated. Put another way — the days on market (DOM) have shortened making our market more efficient or faster.
For San Mateo County, inventory of single family residences stood at 243 in November down from 318 last month. Sales (accepted offers) were 318 a decrease from 460 last month. For both counties, the inventory continues to lag far below the historical average for this time of the year placing pressure on buyers as evidenced in the predominance of multiple offer situations and heated competition between buyers trying to enter the market.
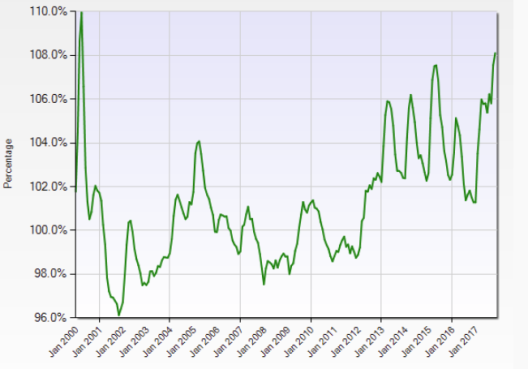
Sale price to list price ratio, an important key market condition indicator, shows that for Santa Clara County transactions completed during November this ratio stood at 108.5% and the highest ever for this time of year and a bit lower than the all time high of 110.0% reached in the heady days of the “Dot-com” period in 2000. Last year it stood at 101.5%.
Take a look at the chart below from MLSListings.com which shows the Santa Clara County median price trend since 2000.

Take a look at the chart below from MLSListings.com which shows the Santa Clara County median price trend since 2000.

The hottest market in Santa Clara County belongs to the Cupertino/Sunnyvale market area (median price of about $2.02 million) at 116.8% which means that the average closed sale has a sale price 16.8% higher than the list price! It also registered the lowest median days on market at just 9 which means half the inventory sells in just nine days! The coolest is the South County (Morgan Hill and Gilroy) market area (median price of about $0.85 million) with 101.0% and 30 days of unsold inventory.
Days of unsold inventory are at a record low of just 21.5 for Santa Clara County and 23 for San Mateo County. This means that for Santa Clara County that the entire inventory, if held static, would sell out in less than 22 days!
We still are seeing a cooling trend in the high end of the price ranges in the Los Altos/Palo Alto and Los Gatos/Saratoga market areas. These high-priced homes are staying on the market much longer than those more closely aligned with the median priced homes in those same areas.
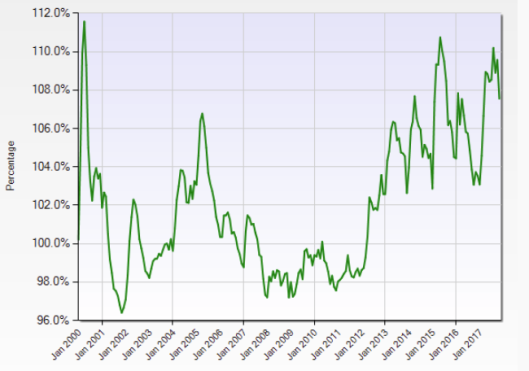
San Mateo County’s overall sale price to list price ratio stands at 108.3% with the highest ratio and hottest market area in the North (Brisbane, Colma, Daly City, Pacifica, San Bruno, South San Francisco) market area (median price of about $0.98 million) at 111.4% with a median days on market of 13. The coolest is the Coast (Half Moon Bay, El Granada, Moss Beach, Montara) market area, (median price of about $1.27 million). As was the case with the high end in Santa Clara County, we’re seeing the same characteristic with those higher priced homes in San Mateo County in Menlo Park, Atherton, Portola Valley, Hillsborough and Woodside along with the high part of the range in the Bay Cities and Redwood City. San Mateo County’s sale price to list price ratio chart is from MLSListings.com.
Take a look at the chart below from MLSListings.com which shows the San Mateo County median price trend since 2000.
Take a look at the chart below from MLSListings.com which shows the San Mateo County median price trend since 2000.

As always, market dynamics change and the supply and demand relationships can vary by area. If you would like specific market condition information for your area or neighborhood or a current home valuation, please feel free to call me, your Remax Agent! You are welcome to leave your comments or questions or contact me directly at my website. Check out and “like” my Facebook Business Page (have over 750 likes – help me to reach 1,000!) or follow me on my Twitter Page.Thank you.