Showing posts with label menlo park. Show all posts

Thursday, February 22, 2018

February Silicon Valley Real Estate Update

Quick Market Summary: With the median price up 25.5% in the last year in Santa Clara County, we're still in a continued hot streak. Amazing, yes, but that doesn't mean every single home went up that much. Median price is the middle transaction of those that closed escrow during the month. It's more accurate to use median prices as an indicator of the overall trend. Supply and demand -- low inventory or supply coupled with high demand means higher prices. Basic economic theory. When record low inventory is mixed with a goodly amount of buyer demand, you get higher prices. Median prices continue to set records — in Santa Clara County it was $1,155,000 and $1,550,000 in San Mateo County in January. The Santa Clara County median price for condos/townhouses is $750,000. Demand continues to outstrip supply in Santa Clara County as 73.0% of homes that closed escrow sold for more than list price inferring multiple offers and a record for this time of year. It was 66% in San Mateo County. Will demand increase as we get into early spring -- we'll see but this is what occurs each year almost without fail.
Nuts and Bolts: Inventory or the amount of homes available for purchase in Santa Clara County was 452 down 27% from last year at this time. Sales (accepted offers) were 675 down from 689 or 2.0% from the same month last year. You'd think that sales would be down as much as inventory if you believe that some agents say that sales are limited by inventory. They forget that there is another variable to consider -- turnover. A faster market or one with a shorter number of days on market easily cancels or mitigates a lower level of inventory. Think the turnover in the fruit and vegetable portion of the market versus the turnover for packaged goods. Average days on market has dropped to just 17 -- lowest ever!
For San Mateo County, inventory of single family residences stood at 197 in January. Sales (accepted offers) were 252. Each of these much lower. For both counties, the inventory continues to lag far below the historical average for this time of the year placing pressure on buyers as evidenced in the predominance of multiple offer situations and heated competition between buyers trying to enter the market.
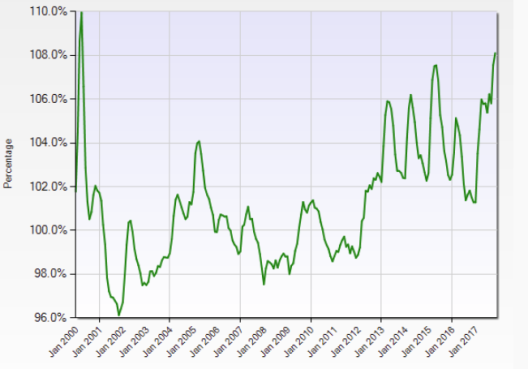
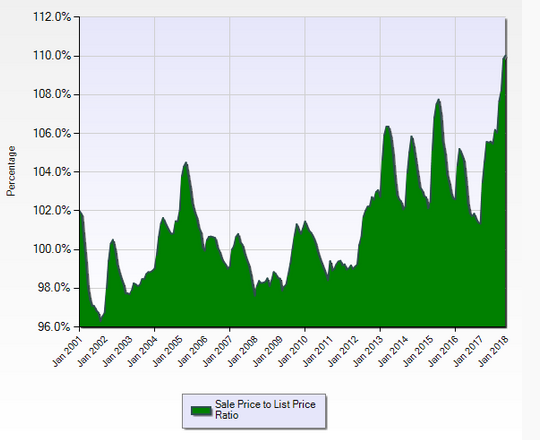
Sale price to list price ratio, an important key market condition indicator, shows that for Santa Clara County transactions completed during January this ratio stood at 108.5% and the highest ever for this time of year. The all time high of 110.0% was reached in the heady days of the “Dot-com” period in 2000. Last year at this time it stood at 101.4%.

Take a look at the chart below from MLSListings.com which shows the Santa Clara County sales price to list price ratio trend since 2001. Any value above 100% is an average that is above list price and infers multiple offers.
SCC_SPLP_Ratio_0118.png

The hottest market in Santa Clara County belongs to the      Cupertino/Sunnyvale market area (median price of about $2.28 million) at 116.6% which means that the average closed sale has a sale price 16.6% higher than the list price! It also registered a low median days on market at just 9 which means half the inventory sells in just nine days! The coolest is the South County (Morgan Hill and Gilroy) market area (median price of about $0.85 million) with 100.3% and 30 days of unsold inventory.
Days of unsold inventory are at a record low of just 23 for Santa Clara County and 27 for San Mateo County. This means that for Santa Clara County that the entire inventory, if held static, would sell out in less than 23 days!
Even with the backdrop of the hot market we're still seeing a cooling off of the high end of the price ranges in the Los Altos/Palo Alto and Los Gatos/Saratoga market areas. These high-priced homes are staying on the market longer than those more closely aligned with the median priced homes in those same areas. Sellers need to be more aggressive with listing a home that has an expected sales price substantially higher than the median in the immediate area.
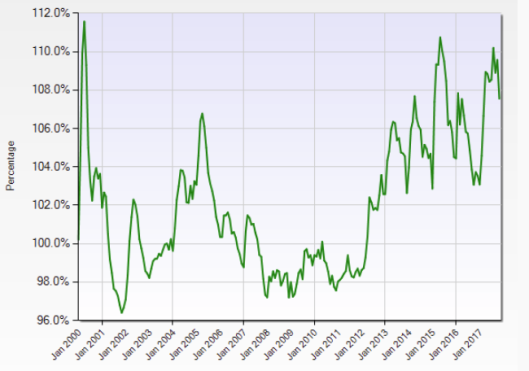
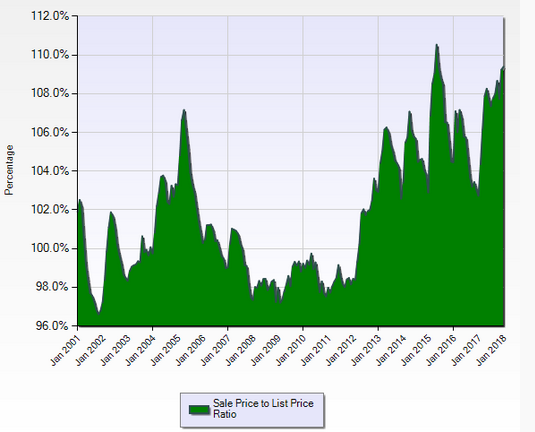
San Mateo County’s overall sale price to list price ratio stands at 109.6% with the highest ratio and hottest market area in the North (Brisbane, Colma, Daly City, Pacifica, San Bruno, South San Francisco) market area (median price of about $1.13 million) at 113.7% with a median days on market of 11. The coolest is the Coast (Half Moon Bay, El Granada, Moss Beach, Montara) market area, (median price of about $1.39 million). As was the case with the high end in Santa Clara County, we’re seeing the same characteristic with those higher priced homes in San Mateo County in Menlo Park, Atherton, Portola Valley, Hillsborough and Woodside along with the high part of the range in the Bay Cities and Redwood City. San Mateo County’s sale price to list price ratio chart is from MLSListings.com.
Take a look at the chart below from MLSListings.com which shows the San Mateo County sales price to list price ratio trend since 2001.
SMC_SPLP_Ratio_0118.png
As always, market dynamics change and the supply and demand relationships can vary by area. If you would like specific market condition information for your area or neighborhood or a current home valuation, please feel free to call me, your Remax Agent! You are welcome to leave your comments or questions or contact me directly at my website. Check out and “like” my Facebook Business Page (have over 750 likes – help me to reach 1,000!) or follow me on my Twitter Page.Thank you.

Friday, December 22, 2017

December Silicon Valley Real Estate Market Update

Quick Market Summary: Up and away. That's the characterization of the continued hot streak as November prices jumped and are 25.1% higher than the same month a year ago. Yes, you read that right! When record low inventory is mixed with a goodly amount of buyer demand, you get higher prices. Median prices continue to set records — in Santa Clara County it was $1,289,000 and $1,513,000 in San Mateo County. The Santa Clara County median price for condos/townhouses is $790,000. Demand continues to outstrip supply in Santa Clara County as 77.9% of homes that closed escrow sold for more than list price inferring multiple offers and was 75% in San Mateo County. The historical averages we've seen in most of the past 20 years of a settling down of the market come late fall, is totally out the window. The question becomes is the sharp increases we've seen at this time of the year caused by buyers getting a jump on the historically busy late winter-early spring OR will be see a continuation of the high demand next year too.
Nuts and Bolts: Inventory or the amount of homes available for purchase in Santa Clara County was a paltry 486 down from 645 last month and down from 750 the same month last year or a decrease of 35.2%! Sales (accepted offers) were 791 down from 1,003 last month and decreased 1.7% from 805 the same month last year. Closed sales were interesting — they were 738 down from 797 last month and 826 the same month last year, a decrease of 10.7%. Comparing the large reduction of inventory and the smaller drop in offers accepted, we’ve seen that turnover has accelerated. Put another way — the days on market (DOM) have shortened making our market more efficient or faster.

For San Mateo County, inventory of single family residences stood at 243 in November down from 318 last month. Sales (accepted offers) were 318 a decrease from 460 last month. For both counties, the inventory continues to lag far below the historical average for this time of the year placing pressure on buyers as evidenced in the predominance of multiple offer situations and heated competition between buyers trying to enter the market.

Sale price to list price ratio, an important key market condition indicator, shows that for Santa Clara County transactions completed during November this ratio stood at 108.5% and the highest ever for this time of year and a bit lower than the all time high of 110.0% reached in the heady days of the “Dot-com” period in 2000. Last year it stood at 101.5%.

Take a look at the chart below from MLSListings.com which shows the Santa Clara County median price trend since 2000.


The hottest market in Santa Clara County belongs to the Cupertino/Sunnyvale market area (median price of about $2.02 million) at 116.8% which means that the average closed sale has a sale price 16.8% higher than the list price! It also registered the lowest median days on market at just 9 which means half the inventory sells in just nine days! The coolest is the South County (Morgan Hill and Gilroy) market area (median price of about $0.85 million) with 101.0% and 30 days of unsold inventory.

Days of unsold inventory are at a record low of just 21.5 for Santa Clara County and 23 for San Mateo County. This means that for Santa Clara County that the entire inventory, if held static, would sell out in less than 22 days!

We still are seeing a cooling trend in the high end of the price ranges in the Los Altos/Palo Alto and Los Gatos/Saratoga market areas. These high-priced homes are staying on the market much longer than those more closely aligned with the median priced homes in those same areas.

San Mateo County’s overall sale price to list price ratio stands at 108.3% with the highest ratio and hottest market area in the North (Brisbane, Colma, Daly City, Pacifica, San Bruno, South San Francisco) market area (median price of about $0.98 million) at 111.4% with a median days on market of 13. The coolest is the Coast (Half Moon Bay, El Granada, Moss Beach, Montara) market area, (median price of about $1.27 million). As was the case with the high end in Santa Clara County, we’re seeing the same characteristic with those higher priced homes in San Mateo County in Menlo Park, Atherton, Portola Valley, Hillsborough and Woodside along with the high part of the range in the Bay Cities and Redwood City. San Mateo County’s sale price to list price ratio chart is from MLSListings.com.

Take a look at the chart below from MLSListings.com which shows the San Mateo County median price trend since 2000.


As always, market dynamics change and the supply and demand relationships can vary by area. If you would like specific market condition information for your area or neighborhood or a current home valuation, please feel free to call me, your Remax Agent! You are welcome to leave your comments or questions or contact me directly at my website. Check out and “like” my Facebook Business Page (have over 750 likes – help me to reach 1,000!) or follow me on my Twitter Page.Thank you.

Tuesday, November 14, 2017

November Silicon Valley Real Estate Market Update

Quick Market Summary: The hot streak continues as October is added to the hottest real estate market period in history! Buyers seem to be getting a jump on expected future price gains and/or higher mortgage rates. Normal market trends have late summer and fall prices drifting lower along with sales and inventory. Not so this year! In October, inventory of available homes for sale attained what looks like a record low in Santa Clara County of just 645 single family residences. Median prices continue to set records — in Santa Clara County it was $1,250,000 and $1,525,000 in San Mateo County. The Santa Clara County median price for condos/townhouses is $767,000. Demand continues to outstrip supply in Santa Clara County as 75% of homes that closed escrow sold for more than list price inferring multiple offers and was 84% in San Mateo County. Historically, we see a higher level of interest from buyers post-Labor Day that lasts for a month or so and then things tend to settle down as we approach the holidays.
Nuts and Bolts: Inventory or the amount of homes available for purchase in Santa Clara County was just 645 down from 700 last month and down from 1,116 the same month last year or a decrease of 42.2%! Sales (accepted offers) were 1,003 down from 995 last month and decreased 8.7% from 1,098 the same month last year. Closed sales were interesting — they were 797 in October, 886 last month in September but only 859 last year, a decrease of 7.2%. Comparing the large reduction of inventory and the smaller drop in offers accepted, we’ve seen that turnover has accelerated. Put another way — the length of escrows have shortened making our market more efficient or faster.

For San Mateo County, inventory of single family residences stood at 318 in October down from 396 last month. Sales (accepted offers) were 460 an increase from 393 last month. For both counties, the inventory continues to lag far below the historical average for this time of the year placing pressure on buyers as evidenced in the predominance of multiple offer situations and heated competition between buyers trying to enter the market.

Sale price to list price ratio, an important key market condition indicator, shows that for Santa Clara County transactions completed during October this ratio stood at 107.7% and the highest ever for this time of year and a bit lower than the all time high of 110.0% reached in the heady days of the “Dot-com” period in 2000. Last year it stood at 101.9%. Take a look at the chart below from MLSListings.com which shows this ratio since 2000.

SP_to_LP_Ratio_SCC_2017-11-14_1012

Currently, the highest ratio and the hottest market belongs to the Cupertino/Sunnyvale market area (median price of about $1.80 million) at 113.7% which means that the average closed sale has a sale price 13.7% higher than the list price. It also registered the lowest median days on market at just 8 which means half the inventory sells in just eight days! The coolest is the South County (Morgan Hill and Gilroy) market area (median price of about $0.82 million) with 101.0% and 15 days.

Days of unsold inventory are at a record low of just 22.5 for Santa Clara County and 31 for San Mateo County. This means that for Santa Clara County that the entire inventory, if held static, would sell out in less than 23 days!

The high end of the price ranges in the Los Altos/Palo Alto and Los Gatos/Saratoga market areas are showing signs of cooling. They are staying on the market much longer than those more closely aligned with the median priced homes in those same areas.

San Mateo County’s overall sale price to list price ratio stands at an even higher level of 110.2% with the highest ratio and hottest market area in the North (Brisbane, Colma, Daly City, Pacifica, San Bruno, South San Francisco) market area (median price of about $1.00 million) at 111.8% with a median days on market of 14. The coolest is the Coast (Half Moon Bay, El Granada, Moss Beach, Montara) market area, (median price of about $1.23 million). As was the case with the high end in Santa Clara County, we’re seeing the same characteristic with those higher priced homes in San Mateo County in Menlo Park, Atherton, Portola Valley, Hillsborough and Woodsidealong with the high part of the range in the Bay Cities and Redwood City. San Mateo County’s sale price to list price ratio chart is from MLSListings.com.

SP_to_LP_Ratio_SMC_2017-11-14_1015

As always, market dynamics change and the supply and demand relationships can vary by area. If you would like specific market condition information for your area or neighborhood or a current home valuation, please feel free to call me, your Remax Agent! You are welcome to leave your comments or questions or contact me directly at my website. Check out and “like” my Facebook Business Page (have over 750 likes – help me to reach 1,000!) or follow me on my Twitter Page.Thank you.

Thursday, October 12, 2017

October Silicon Valley Real Estate Market Update

Quick Market Summary: This past several months has been the hottest real estate market period in history! Perhaps buyers are getting a jump on the normal upswing that comes in early spring of each year. Anemic inventory levels coupled with the threat of higher mortgage rates and robust buyer activity and demand provided the price pop we witnessed. In September, inventory of available homes for sale attained a record low in Santa Clara County and very close to a record in San Mateo County. Median prices continue to set records — in Santa Clara County it was $1,180,000 and $1,465,000 in San Mateo County. The Santa Clara County median price for condos/townhouses is $720,000. Demand continues to outstrip supply in Santa Clara County as 70% of homes that closed escrow sold for more than list price inferring multiple offers and was 72% in San Mateo County. Historically, we see a higher level of interest from buyers post-Labor Day that lasts for a month or so and then things tend to settle down as we approach the holidays. Things WILL settle somewhat during this period but I believe we're in for higher prices early next year provided no huge external event changes the outlook.

Nuts and Bolts: Inventory or the amount of homes available for purchase in Santa Clara County was just 700 down from 723 last month and down from 1,277 the same month last year or a decrease of 45.2%! Sales (accepted offers) were 995 down from 1,131 last month but decreased from 1,118 the same month last year. Closed sales were interesting — they were 886 in September but only 826 last year, an increase of 7.3%. That busts the myth that sales are constrained by a lack of inventory as what we witnessed was a turnover rate faster than at any time in the last 20 years!

Here is a chart of the months of inventory for Santa Clara County single family residences from MLSListings. Please note the new all-time low reached last month.

 
For San Mateo County, inventory of single family residences stood at 396, up from 330 last month. Sales (accepted offers) were 393 and increased from 366 last month. For both counties, the inventory continues to lag well below the average for this time of the year placing pressure on buyers as evidenced in the predominance of multiple offer situations and heated competition between buyers trying to enter the market.

Here is a chart of the months of inventory for San Mateo County single family residences from MLSListings. It shows super low levels but not quite historic lows. 


Sale price to list price ratio, an important key market condition indicator, shows that for Santa Clara County transactions completed during September this ratio stood at 105.9% and the highest ever for this time of year! Last year it stood at 101.7%. Currently, the highest ratio and the hottest market area belong to  the Cupertino/Sunnyvale market area (median price of about $1.86 million) at 112.3% which means that the average closed sale has a sale price 12.3% higher than the list price. It also registered the lowest median days on market at just 10 which means half the inventory sells in just ten days! The coolest market area is Los Gatos/Saratoga (median price of about $2.40 million). 
 
The high end of the price ranges in the Los Altos, Los Altos Hills, Palo Alto, Los Gatos and Saratoga market areas are showing signs of cooling.
 
San Mateo County’s overall sale price to list price ratio stands at an even higher level of 109.1% with the highest ratio and hottest market area in the Bay Cities (Belmont, Burlingame, Millbrae, San Carlos, San Mateo) market area (median price of about $1.66 million) at 113.0% with a median days on market of 11. The coolest market area is the Expensive (Atherton, Menlo Park, Portola Valley, Woodside, Hillsborough) market area, (median price of about $3.55 million). As was the case with the high end in Santa Clara County, we're seeing the same characteristic with those higher priced homes in San Mateo County in Menlo Park, Atherton, Portola Valley, Hillsborough and Woodside along with the high part of the range in the Bay Cities and Redwood City.
 
As always, market dynamics change and the supply and demand relationships can vary by area. If you would like specific market condition information for your area or neighborhood or a current home valuation, please feel free to call me, your Remax Agent! You are welcome to leave your comments or questions or contact me directly at my website. Check out and "like" my Facebook Business Page (have over 750 likes - help me to reach 1,000!) or follow me on my Twitter PageThank you.

Thursday, September 28, 2017

September Silicon Valley Real Estate Market Update

Quick Market Summary: We’ve gone through the historically hottest part of the year where a higher wave of buyer activity (demand) comes knocking. Now, we are in the summer months with many potential buyers in vacation mode so the activity is less intense EXCEPT for this year! With low inventory and enticingly low mortgage rates, we’ve seen a very brisk summer market. In August, inventory of available homes for sale remained anemic in each county. Median prices continue to set records — in Santa Clara County it was $1,150,000 and $1,423,000 in San Mateo County. Even though these levels have drifted slightly lower the past couple of months, they represent record median prices for this time of year in the Silicon Valley real estate market. It's always better to compare year over year results as it removes the seasonality aspect. The Santa Clara County median price for condos/townhouses is $760,000. Demand continues to outstrip supply in Santa Clara County as 74% of homes that closed escrow sold for more than list price inferring multiple offers and was 80% in San Mateo County. Historically, we see a higher level of interest from buyers post-Labor Day that lasts for a month or so. I expect higher prices.
Nuts and Bolts: Inventory or the amount of homes available for purchase in Santa Clara County was just 723 down from 834 last month and down from 1,278 the same month last year or 43.4%! Sales (accepted offers) were 1,131 down from 1,146 last month but increased slightly from 1,118 the same month last year. Closed sales were interesting — they were 919 in August but only 832 last year, an increase of 10.5%. That busts the myth that sales are constrained by a lack of inventory as what we witnessed was a turnover rate faster than at any time in the last 20 years!
For San Mateo County, inventory of single family residences stood at 330, up slightly from 319 last month with sales (accepted offers) at 393 an increase from 366 last month. For both counties, the inventory continues to lag well below the average for this time of the year placing pressure on buyers as evidenced in the predominance of multiple offer situations and heated competition between buyers to enter the market.
Sale price to list price ratio, a key market condition indicator, shows that for Santa Clara County transactions completed during August this ratio stood at 106.4% and the highest ever for this time of year! Currently, the highest ratio and the hottest market area belong to the Cupertino/Sunnyvale market area (median price of about $1.90 million) at 114.0% which means that the average closed sale has a sale price 14% higher than the list price. It also registered the lowest median days on market at just 8 which means half the inventory sells in 8 days! The coolest market area is Los Gatos/Saratoga (median price of about $2.55 million). However, even the coolest market area in Santa Clara County is still pretty good with Los Gatos currently more active than Saratoga.
San Mateo County’s overall sale price to list price ratio stands at an even higher level of 109.1% with the highest ratio and hottest market area in the Bay Cities (Belmont, Burlingame, Millbrae, San Carlos, San Mateo) market area (median price of about $1.60 million) at 110.7% with a median days on market of 11. The coolest market area are the Expensive (Atherton, Menlo Park, Portola Valley, Woodside, Hillsborough) market area, (median price of about $3.00 million) and the San Mateo Coast (Half Moon Bay, El Granada, Moss Beach, Montara) (median price of about $1.29 million.
As always, market dynamics change and the supply and demand relationships can vary by area. If you would like specific market condition information for your area or neighborhood or a current home valuation, please feel free to call me, your Remax Agent! You are welcome to leave your comments or questions or contact me directly. Check out and "like" my Facebook Business Page at Facebook Business Page (I'm trying for 1,000 likes!) or follow me on Twitter at Twitter Page. Thank you.

August Silicon Valley Real Estate Market Update

Quick Market Summary: We’ve gone through the historically hottest part of the year where a higher wave of buyer activity (demand) comes knocking. Now, we are in the summer months with many potential buyers in vacation mode so the activity is less intense. We continue to have buyer interest and activity but it is countered by continued low inventory. In July, inventory of available homes for sale remained anemic in each county. Median prices continue to set records — in Santa Clara County it was $1,168,000 and $1,600,000 in San Mateo County. Even though these levels have drifted slightly lower, they represent record median prices for this time of year in the Silicon Valley real estate market. Demand continues to outstrip supply in Santa Clara County as 74% of homes that closed escrow sold for more than list price inferring multiple offers. Same proportion in San Mateo County. Post Labor Day, we’ll see even more buyer activity so would expect prices to remain strong.
Nuts and Bolts: Inventory or the amount of homes available for purchase in Santa Clara County was just 834 with sales (accepted offers) of 1,146. In this measure, a downtrend in inventory levels continues in force since 2012!
For San Mateo County, inventory of single family residences stood at 319 with sales (accepted offers) at 366. For both counties, the inventory continues to lag below the average for this time of the year placing pressure on buyers as evidenced in the predominance of multiple offer situations and heated competition between buyers.
Sale price to list price ratio, a key market condition indicator, shows that for Santa Clara County transactions completed during July, this ratio stood at 105.5% and among the highest for this time of year over the past 17 years! Currently, the highest ratio and the hottest market area belong to the Cupertino/Sunnyvale market area (median price of about $1.90 million) at 111.5%. It also registered the lowest median days on market at just 8 which means half the inventory sells in less than 8 days! The coolest market area is South County (Morgan Hill/Gilroy) (median price of about $0.80 million).
San Mateo County’s overall sale price to list price ratio stands at an even higher level of 108.5% with the highest ratio and hottest market area in the Bay Cities (Belmont, Burlingame, Millbrae, San Carlos, San Mateo) market area (median price of about $1.70 million) at 112.0%. The coolest market area is the Expensive (Atherton, Menlo Park, Portola Valley, Woodside, Hillsborough) market area, (median price of about $3.33 million).
As always, market dynamics change and the supply and demand relationships can vary by area. If you would like specific market condition information for your area or neighborhood or a current home value, please feel free to call me, your Remax Agent! You are welcome to leave your comments or questions or contact me directly. Thank you.

Friday, July 13, 2012

July Silicon Valley Real Estate Market Comments

Here are my observations of the most recent June transactions for Santa Clara County real estate and San Mateo County real estate. Your comments and questions are always welcome. If you see something in your neighborhood that you are curious about or have a question, please don't hesitate to share with us. If you have questions or a comment, please leave them here, or feel free to contact me through my website or send me an email.

General Market Observations and Comments -- The amount of homes (single family and condos and townhouses) available for sale continue at low levels continuing the pattern started at the beginning of the year. Normally, inventory levels start their climb in early spring and peak by mid-year but not this time. Most areas in both counties have the characteristics of a seller's market with more than half of the closings during June had a sales price greater than a list price. A well-priced listing has a tendency to attract multiple offers.

Want to Be First Time Buyers? Part 3 --  Rents are continuing to jump as there is more demand than supply of rental units. This week, mortgage rates again reached record lows so it may be more advantageous to own than to rent provided you plan on living in the home for a while.

Median Prices Increase -- Median prices of single family, condo and townhouse homes continue to march upward. For June, Santa Clara County's median price for single family residences, half above and half below or the middle transaction, increased to $686,000, as more and more lower priced homes have been scooped up whereas the median sales price for San Mateo County was $840,000.

Median Days on Market Drops -- Some real estate practitioners are mentioning that it takes on average about six weeks (40 days) to sell a home and they consider that good. However, most sellers wouldn't consider that good when you tell them it will take an average of that long to sell! In actuality, it now takes but 13 days to sell half of the homes. That is the median days on market. The difference is that those homes that have issues, are grossly overpriced or just plain super expensive sit on the market for a long time thus bringing the average up and does not impact the median which is the middle transaction. When I provide advice to sellers I use the median and calculate it down to their neighborhood or as small an area as possible.

Inventory of Available Homes for Sale Continue at Low Levels -- There were just 1,296 single family residences for sale in Santa Clara County and just 606 in San Mateo County. Not record lows but each are about 56% lower than in June 2011.

What's HOT and What's NOT -- In Santa Clara County, the hottest market area is Santa Teresa, North Valley, Blossom Valley portions of San Jose and Milpitas with a Days of Unsold Inventory (DUI) of 24. In San Mateo County, the hottest area is Foster City with a DUI of 18. What's not is Los Gatos/Saratoga in Santa Clara County with a DUI of 66 and the expensive areas of Menlo Park, Atherton, Portola Valley, Hillsborough and Woodside in San Mateo County with a DUI of 76.
 
OK, I'm bragging so I'm repeating that Sunnyvale is #7 in the U.S. -- According to the Kiplinger Personal Finance survey, Sunnyvale was named as the 7th greatest city in the United States to raise kids. As a long-time resident of Sunnyvale and where my wife and I have raised our two sons, I'd have to agree! For a glimpse at Kiplinger's write-up of Sunnyvale, here's a link.


Thanks for reading my blog. I'm Tom McEvoy, Realtor with RE/MAX Santa Clara Valley -- Let me know if you have any comments, questions, observations or any future topics you'd like me to address.

Thursday, February 7, 2008

Owning property with a non-spouse

As a real estate professional, I come into contact with individuals who are planning to purchase a property with another person not their spouse. This is an extremely tricky area because the partners could have a falling out or something happens to one of them to change their mind about their share of the ownership.

  • One, a father told me that his son and his girlfriend were going to buy a home together. I suggested that his son and girlfriend needed a written contract or an agreement as they weren't yet married. The father's remark was something like "of course they will get married, I'll disown my son if he doesn't marry his girlfriend". Now, I was just trying to help and head off some potential problems that may have occurred due to their non-spousal relationship.

  • In a second situation, I was working with a young professional women who wanted to purchase a commercial building to relocate her business to. Her other real estate investment was in a partnership with three other women. She suggested that the three others buy out her portion so that she could proceed with her business plans. When my client received a ridiculously low offer, she had no recourse other than to hire an appraiser and attorney to convince her partners of the proper valuation. No written contract was ever discussed or completed as they all were "good friends". This situation continued to unravel for over a year and even then still had each of the partners paying large legal fees to their own attorneys.

Attending a recent broker's tour meeting at the headquarters of the Silicon Valley Association of Realtors, I heard Nancy Chillag speak to these types of arrangements. Nancy Chillag is an attorney who has practiced law for over 20 years and specializes in construction law, representing both contractors and homeowners. What follows are my notes of her presentation. Hopefully, they will help you keep away from problems that do not have to even come up.

Nancy's first piece of advice is to always have a written contract.

Her second bit of advice was to ask some basic questions before getting into a partnership:

  • Who's going to contribute what to the venture?
  • How are negative cash flows going to be handled?
  • How are repairs and maintenance expenses going to be handled?
  • How is the non-payment by a partner going to be handled? By a loan from the other partner(s)?
  • What type of situations will cause one or more of the partners to a buyout of the remaining partner? This is commonly referred to as a "buyout provision" as part of an exit plan. For instance, many corporations have a succession plan to prepare for the replacement of key executives.
  • How will the value of the property be determined? One manner could be that each partner hires an appraiser and then the appraised amounts are averaged.

Of course, nothing in state law requires that an owner stay with another owner that he/she doesn't want. If the situation disintegrates enough, Nancy said that may call for a partition lawsuit where one partner sues to partition his/her share. Courts normally order a sale of the property and make it subject to their approval. A costly method to employ that often results in less interest by buyers as they don't want to get involved in someone else's legal web.

If you are considering a real estate investment with at least one non-spouse owner, get things taken care of in advance. Contact Nancy Chillag of Chillag & Associates in Menlo Park. Visit Nancy's website at www.chillag.com. She has also authored "Building by the Book: Legal Advice for Contractors" and "How to Survive a Remodel" a book I have in my library.

Thanks for reading!

Friday, January 18, 2008

Martin Luther King Day Events and Holiday Closings Information

This is a partial list of area events celebrating Martin Luther King Day on Monday, January, 21st.

  • Ras Midas - With Root Awakening. Raggae celebration of King's life. 9:30pm today, January 18th. Moe's Alley, 1535 Commercial Way, Santa Cruz, $15. 510-478-5008. www.moesalley.com

  • MLK Birthday Community Sing-along and Concert. Songs from the civil rights, peace and labor movements. 7:30pm Saturday, January 19th. Peninsula Peace and Justice Center, 457 Kingsley Ave., Palo Alto. 650-326-8837. www.unitedforpeace.org

  • MLK Jr. Celebration. Special speaker Rev. Robert Olmstead "Continuing Dr. King's Dream of Truth, Peace & Justice". 3:00pm Sunday, January 20th, First United Methodist Church of Palo Alto, 625 Hamilton Ave., Palo Alto. 650-323-6167.

  • MLK Day Celebration. With musical group Hey Mom! 11:30am, Sunday, January 20th, Kepler's Books, 1010 El Camino Real, Menlo Park. Free. 650-324-4321.

  • 28th Annual Dr. Martin Luther King Jr. Luncheon. Keynote speaker will be Julia Hare. Noon, Monday, January 21st, African American Community Service Agency, 304 N. Sixth St., San Jose. $35. 408-292-3157.

  • 28th Annual Dr. Martin Luther King Jr. Luncheon. Keynote speaker will be Julia Hare. Noon, Monday, January 21st, Emmanuel Baptist Family Life Center, 467 N. White Rd., San Jose. $35. 408-532-6755.

  • King Plaza Dedication Ceremony. City of Palo Alto is naming Civic Center Plaza in honor of Rev. Martin Luther King Jr. Musical performance by the Stanford Gospel Choir and Eastside Preparatory High School Choir. 2:00pm Monday, January 21st, 250 Hamilton Ave., Palo Alto. www.cityofpaloalto.org/civica/filebank/blobdload.asp?BlobID=9564.

  • Mover of Mountains Award and Scholarship Breakfast. Event will recognize and honor those who follow in the footsteps of King in education and service. 7:00am, Monday, January 21st, Wyndham Hotel, 1350 N. First St., San Jose. $40. For reservations, call 408-428-9551.

Holiday Closings: Federal, State offices will be closed. County offices in Santa Clara, San Mateo, Alameda, Santa Cruz, Monterey, San Benito all will be closed. City offices in the above counties will be closed. No mail delivery. Libraries will be closed. Schools in the above counties will be closed. Banks will be closed.

Travel: BART - regular schedule; Caltrain - regular schedule; Santa Clara Valley Transportation Authority - regular schedule; SamTrans - regular schedule; AC Transit; weekend schedule; Santa Cruz Metropolitan Transit District - weekend schedule; Monterey-Salinas Transit - Sunday schedule; Muni - Saturday schedule, subject to change.

Thanks for reading!