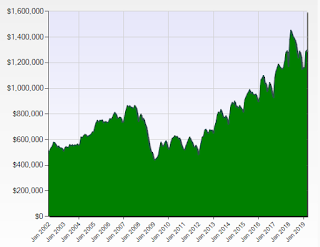
Quick Market Summary: So the (partial) verdict is in -- the spurt in the market has continued. Similar to the stock market since the end of December (minus the last week or so), median prices in Santa Clara and San Mateo counties have rebounded. April statistical information shows a further increase in prices and is close to the time historically in which a peak occurs near the time of Memorial Day weekend. Last year the peak actually arrived earlier and turned into a significant correction. Sellers that decided to list in the latter part of last year were faced with a sizable price correction to ponder. As stated last month and because of the incredible "double ramp up" of prices in the latter part of 2017 and early 2018, we'll see year over year decreases for a while.
So for April results, we see that Santa Clara County median prices are 6.6% lower than in April 2018. Similarly, San Mateo County median prices have decreased 9.7% from the same month a year ago. Median prices for Santa Clara County stood at $1,326,000 versus $1,420,000. In the context of looking at the past two years we've seen the median go from $1,160,000 in April 2017 to $1,326,000 or a two-year gain of 14.3%. For San Mateo County the median was $1,626,000 versus $1,800,000 in the same month a year ago.
Condo and townhouse median price in Santa Clara County reached $874,000 in April compared to $915,000 last year or a decrease of 4.5%.
A monthly chart of Santa Clara County median prices for single family residences show the tremendous "double ramp up" in late 2017 and early 2018. The second chart shows the same information for San Mateo County. Source: MLSListings.
April Nuts and Bolts: Inventory or the amount of homes available for purchase in Santa Clara County was 1,383 up from 837 or 65.2%. Sales (accepted offers) were 1,180 down 0.3% from the same month last year when is was 1,184.
For San Mateo County, inventory of single family residences stood at 468 versus 377 or an increase of 24.1% from April 2018. Sales (accepted offers) were 436 compared to 454 for the same month last year, a decrease of 4.0%.
Sale price to list price ratio, a key market condition indicator, shows that for Santa Clara County transactions completed during the month, this stood at 102.1% compared to last year's ratio of 112.5%, which set a record.
57.4% of homes in Santa Clara County that closed escrow in April sold for more than list price compared to the record 84.5% last year and 75.9% in April 2017. It was 68% in San Mateo County versus 82% last year.
The hottest market in Santa Clara County again belongs to the Cupertino/Sunnyvale market area with a median price of about $2.000 million) at 104.4% which means that the average closed sale has a sale price 4.4% higher than the list price! It also registered a median days on market of 9 which means half the inventory sells in just a bit over one week. The coolest is the South County market area (Morgan Hill, San Martin and Gilroy) with a median price of about $0.910 million) with 99.5%.
Days of unsold inventory and another key indicator which is the intersection of supply of available homes compared to the demand, moved up a bit and stands at 38.6 for Santa Clara County and 38 for San Mateo County. Both of these are higher than last year's figures of 24.7 and 29, respectively. This places both counties squarely in a seller's market condition since the level is below 40.
The hottest market in San Mateo County last month is the North Cities (Brisbane, Colma, Daly City, Pacifica, San Bruno, South San Francisco) market area (median price of about $1.120 million) at 111.0% with a median days on market of 11. The coolest is the Coast (Half Moon Bay, El Granada, Moss Beach, Montara) market area (median price of about $1.352 million) at 98.4% with median days on the market of 19.
As always, markets are always changing and the supply and demand in a particular area or even neighborhood can vary. If you would like specific market condition information for your area or neighborhood or a current home valuation, please feel free to call me, your RE/MAX Gold Agent! You are welcome to leave your comments or questions or contact me directly at my website. Check out and “like” my Facebook Business Page (over 775 have done so) or follow me on my Twitter Page.Thank you.


